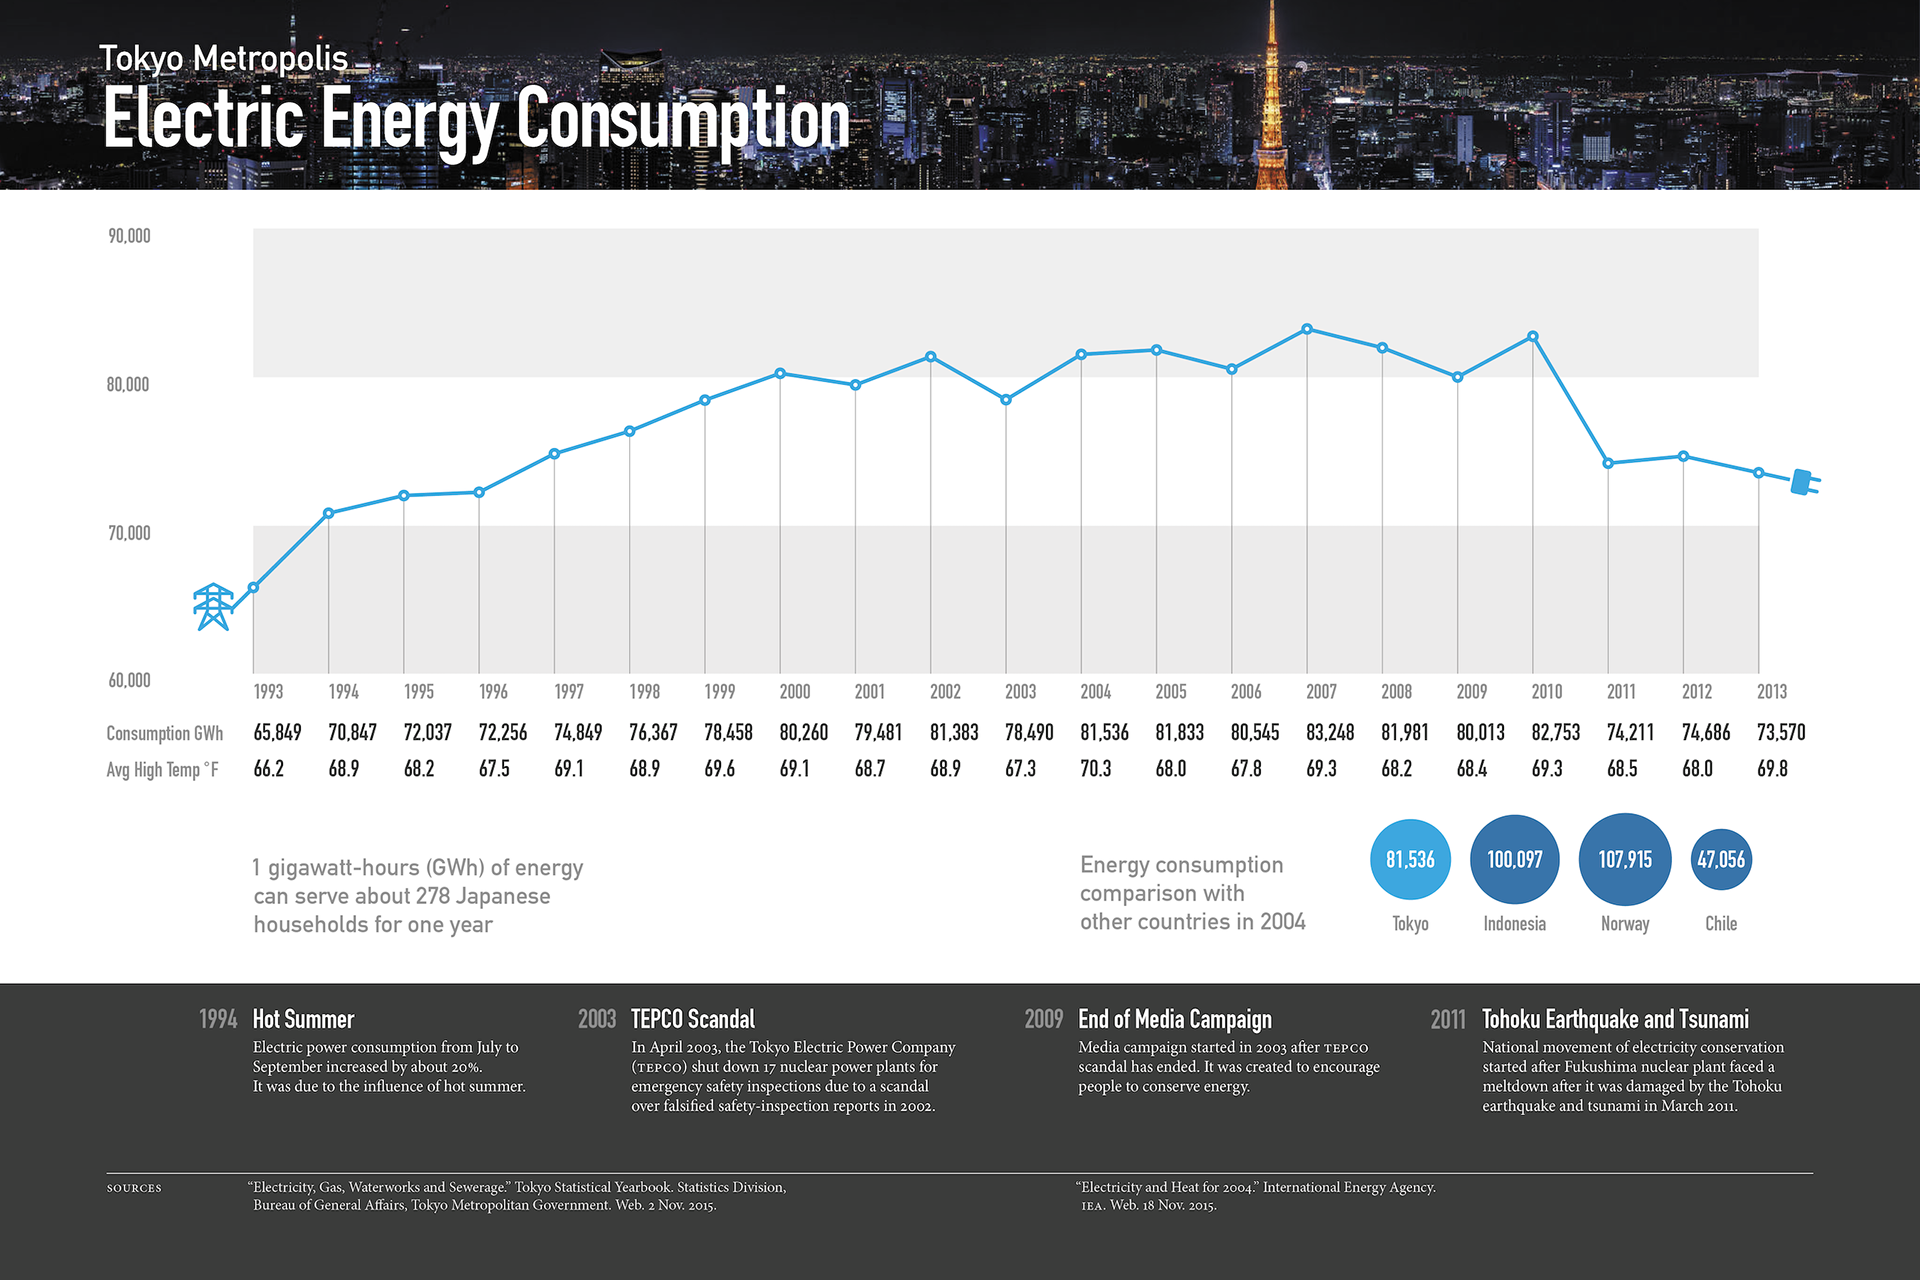
Statistical Design Research has been done for electric energy consumption of Tokyo metropolis. After researching the topic, raw numerical statistical information has been extracted from Tokyo Statistical Yearbook archive and numerical quantities have been plotted in order to see the degree of change over a period of time.
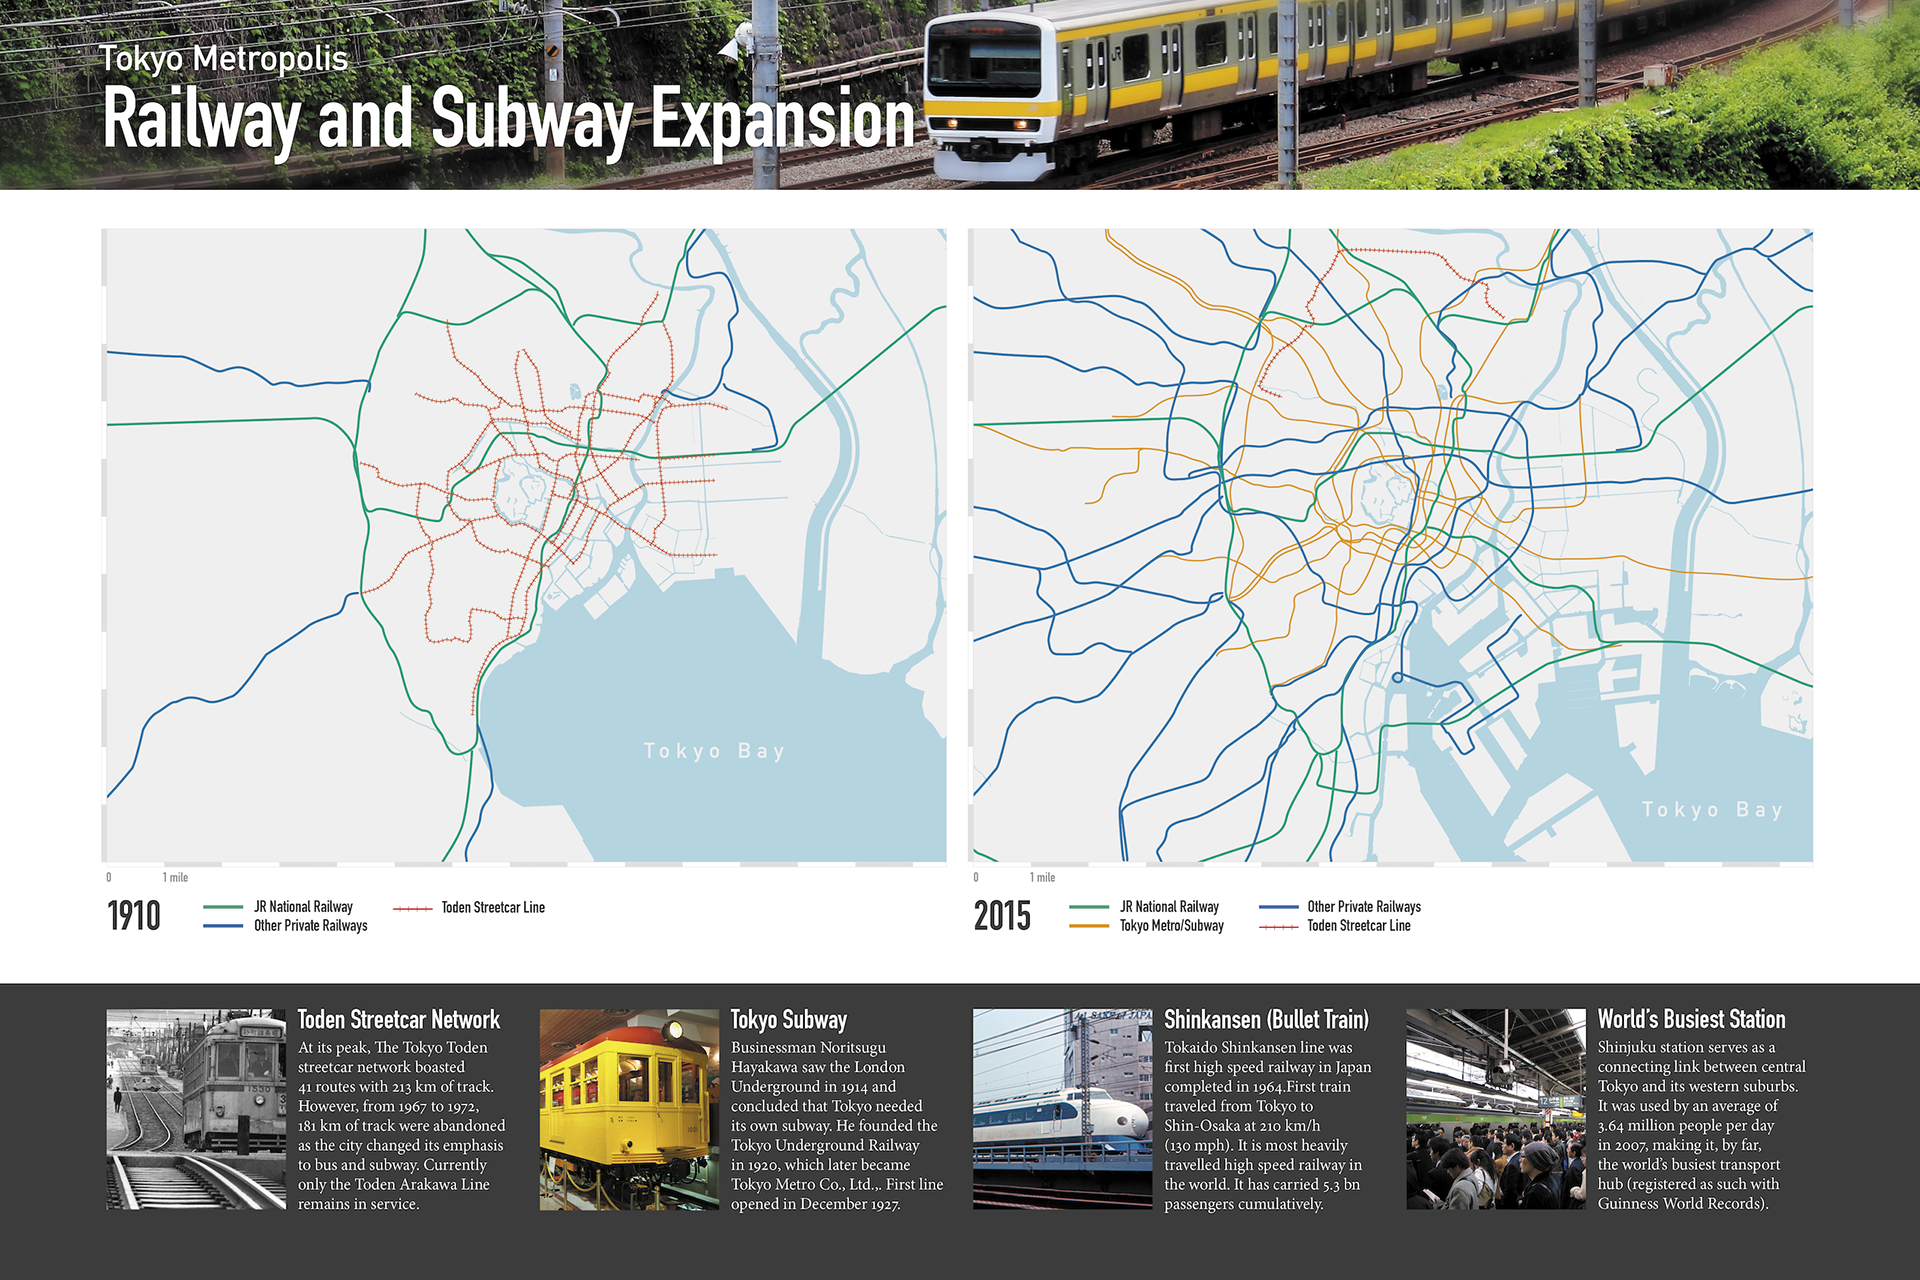
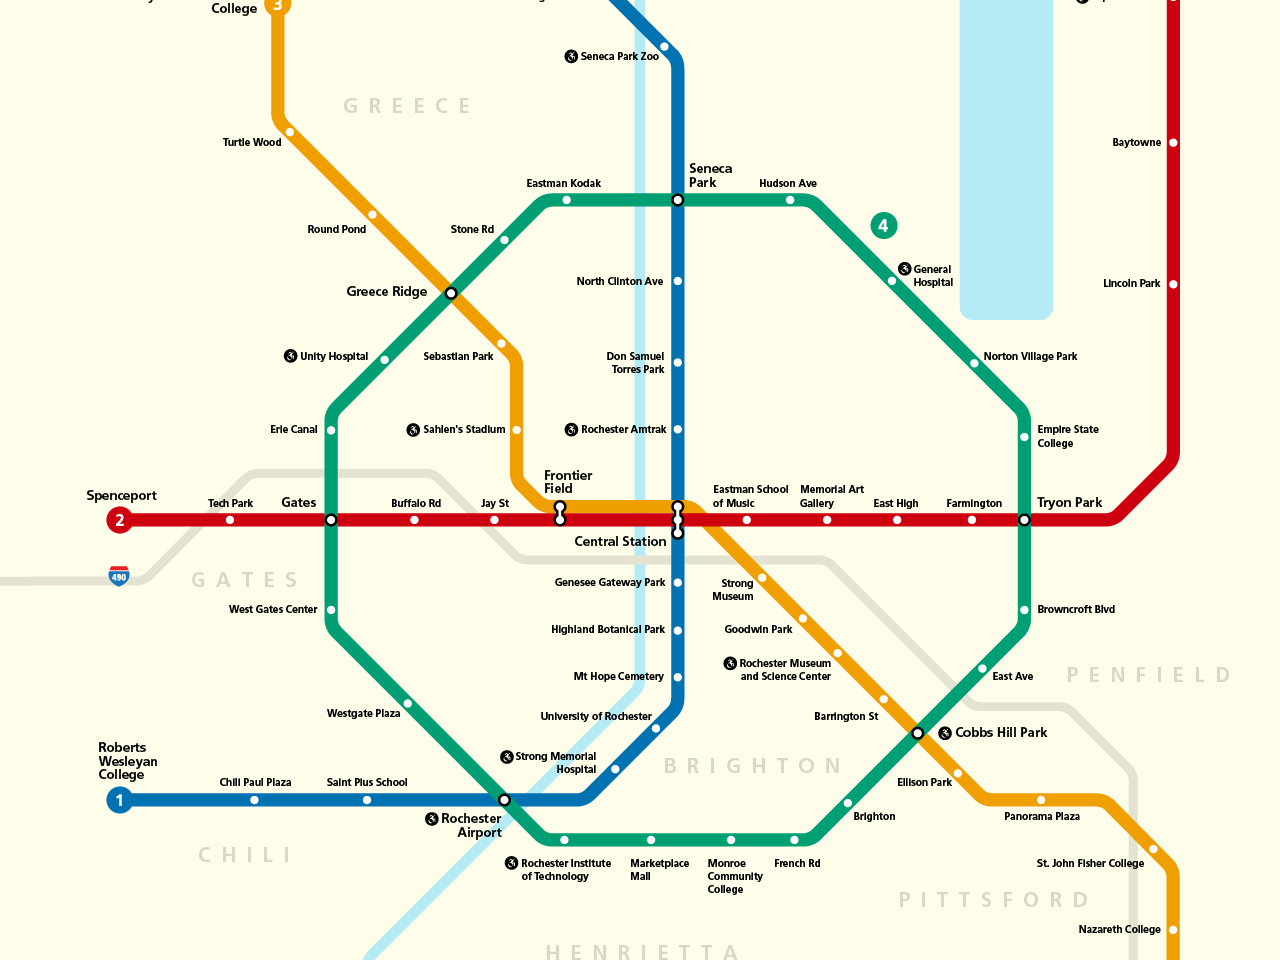
Map Design This is a sequence of geographic maps that communicates a transformation of Tokyo's railway and subway system occurring over a span of 105 years. Many essential resources were referenced from the tokyofiles: maps blog and Old Maps Online, search engine for historical maps. Transit lines were created by manually overlaying and tracing old maps on top of the vector maps generated using OpenStreetMap (OSM) and a Maperative tool.
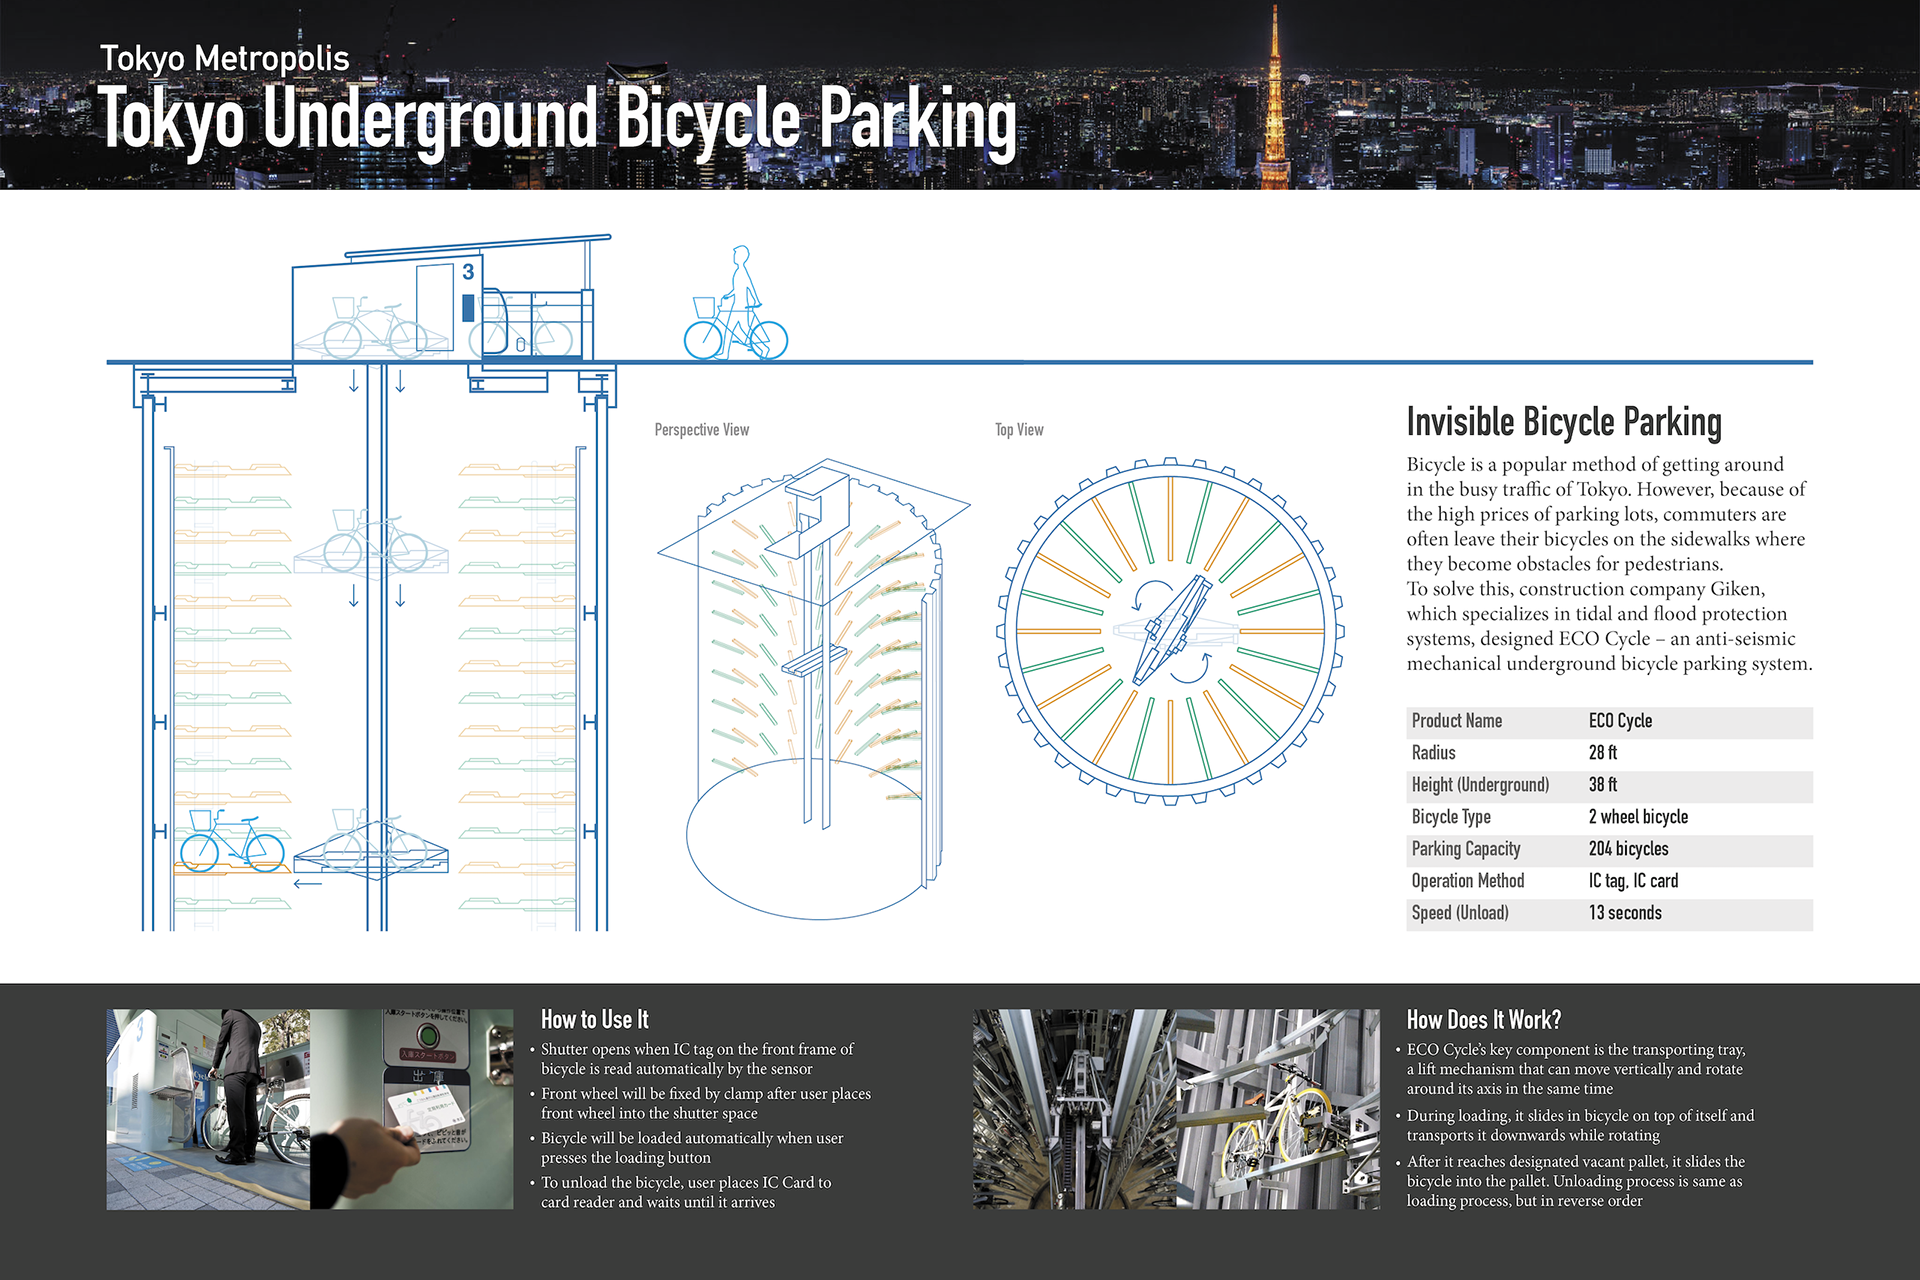
Diagram Design A pictorial diagram explains a structure, function and transition of the ECO cycle – an anti-seismic mechanical underground bicycle parking system.